Camera histograms
Camera histograms

Introduction
First photography is an art, not mechanical activity. So it is more important how your image look, not how the histogram looks. The goal here to make the picture you want, as bright as you want, or as dark, and the histogram can help in a certain extent.
What is the camera histogram ?
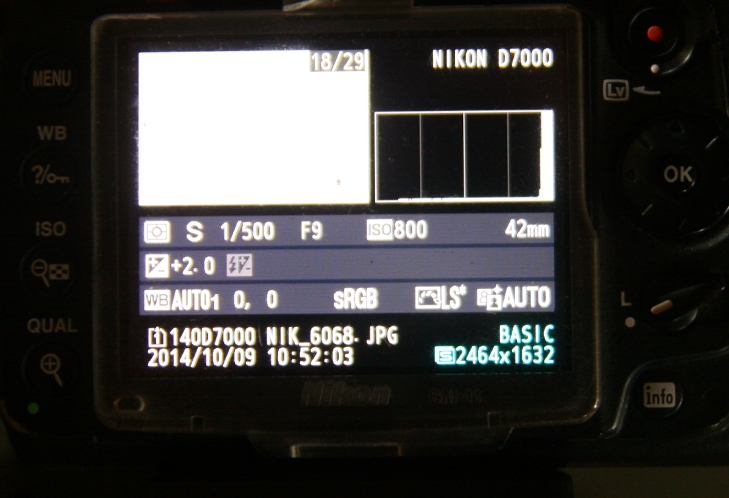
You can see on the top right part of the above picture, it is the camera histogram. The figures shows the brightness of each pixel on a photo. On the horizontal line, the left part represent black color(no detail), the right part is white color(no detail), between the range of colors the camera can capture, we can call this dynamic range as well. If we see reality, there is a lot of detail in the bright and the dark end as well, before gets really black or white. On the vertical shape shows how many pixel you have on the picture at a given tone. For example if we make a pic of a black shadow with nothing else on the picture, just a black color, we would see the histogram only at the left side of the image with full height graphs. See below.

If we make a picture of an all bright white object, than we only see lines at the right side of the image with full height. See below.
If we want to name the parts of the histogram, the left side is shadows, the right side is highlights, the middle is mid-tones.

The above photo is a “normal” photo, but because it was well underexposed (too dark) the histogram goes leftwards to darker regions, normally it would be in the middle, unless we make a photo of a dark or bright scene.
Types of camera histograms
There are two basic types of a camera histogram: the live histogram or the histogram we can check after we made a picture. The live histogram is more used in compact or Milc cameras. Here when we focus with our camera we can check the graph it is on the dark or bright side or in the middle.
The other type of histogram we only can check after actually make a photo. If there is something wrong we must make a new photo.
Simple or Rgb histograms
All histograms above are simple histograms with only 1 graph. But there are Rgb (red green blue) histograms as well. Why is it good ? The camera make the picture from these 3 colours. It might be that the single histogram looks ok, but on color burn out, even if it is not visible. The Rgb histogram solves that because it shows 3 graphs, by channels. Usually the red is the one which usually burn out more easily, and it is visible on the Rgb histogram (out of the 3 on the red histogram).
What are camera histograms are good for ?
With the help of the camera histogram we can check our exposure, or make it simple the brightness of our image. If the histogram touches the right side of the box some part of our image is burned out or will be burned out (white with no details). For landscapes usually brightness is preferred in order to have a good photo. The usual goal is to expose the picture that way that the histogram don’t touch the right side of the frame but be as close to that as possible. Brighter image is always better usually than darker images.
To change the exposure of the image we use a function called exposure compensation. + compensation makes the image brighter, – makes the images darker.
There are situations when I burn out the image, otherwise other more important detail would be too dark on the photo.